Bummer! You must be logged in to access this page.

- Python
- Intermediate
About this Course
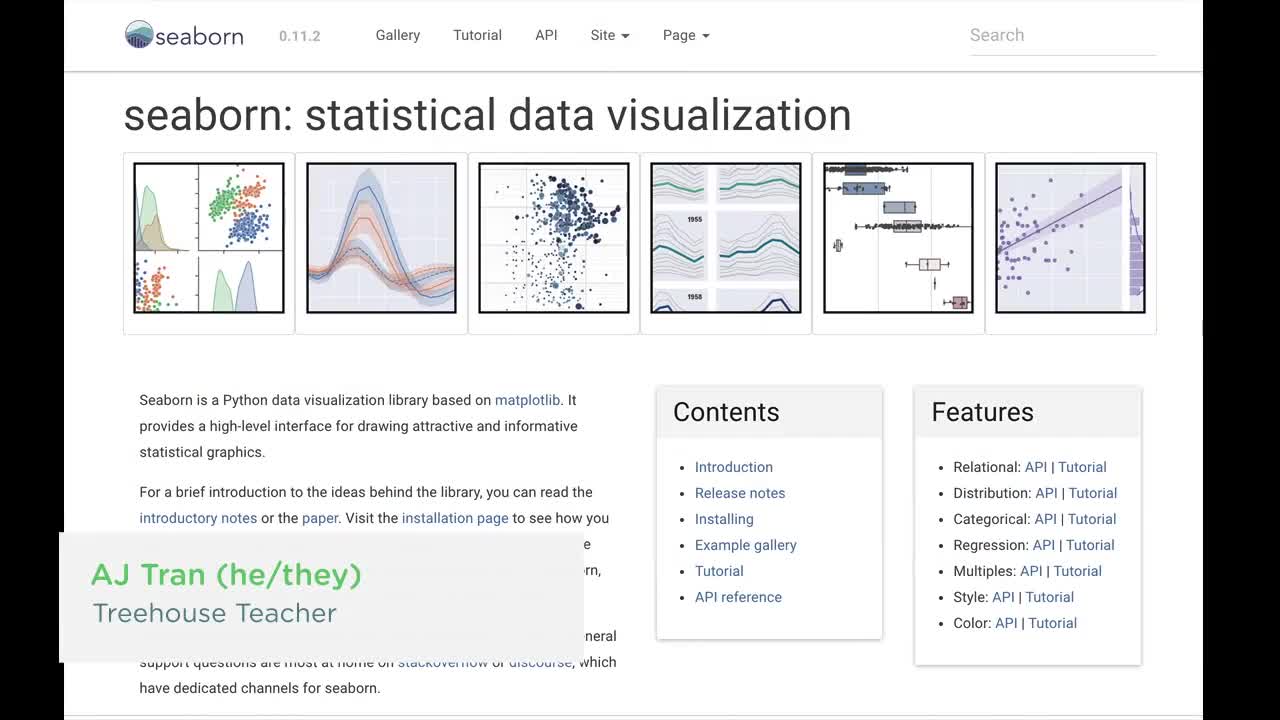
The Seaborn module is a Python visualization library based on Matplotlib. It provides a higher-level, more convenient way to create common statistical plots and is well-suited for labeling and presenting statistical graphics. This course will help you get started with Seaborn by walking through the structure of its library, showing how to create key charts in Seaborn, and comparing the results with equivalent plots created with Matplotlib.
What you'll learn
- Create charts with Python using Seaborn
Introduction to Seaborn
Seaborn is a data visualization library built on top of the plotting library, Matplotlib. It offers a rich set of high-level tools for creating statistical charts and plots. It's more convenient than Matplotlib for quickly visualizing data because it integrates well with Pandas Dataframe objects.
5 stepsPlotting Functions
Now that we've gone through an overview of the different plot types available in Seaborn, let's start using the library! You'll use Seaborn's plotting functions with a Pokemon dataset to perform exploratory data analysis.
9 stepsSeaborn Data Visualization Challenges
Now that you've worked through examples and practiced creating plots with Seaborn, it's time to work on some plots on your own. This stage offers a series of Seaborn challenges you'll complete using the Yu-Gi-Oh! dataset.
7 stepsTeacher
-
AJ Tran
AJ is an instructor who truly believes that new skills offer people the chance to remake their lives.
Through code, AJ was able to transition from the restaurant industry to the Tech industry.
Now, AJ is happy to help people from all around the world learn coding skills at Treehouse!