Preview
Video Player
00:00
00:00
Scatter Plots
7:09Scatter plots are the best plot to use if you are interested in showing relationships between data and seeing trends between two variables.
A scatter plot is used to find
correlations between two variables in
0:00
a dataset.
0:04
Scatter plots are the best plot to
use if you're interested in showing
0:06
relationships between data and
finding trends.
0:11
By plotting one variable on the x-axis and
the other on the y-axis, a scatterplot
0:15
can show us how much correlation, if any,
exists between the two variables.
0:21
The question I have is: for all of
the Caribbean countries in a given year,
0:28
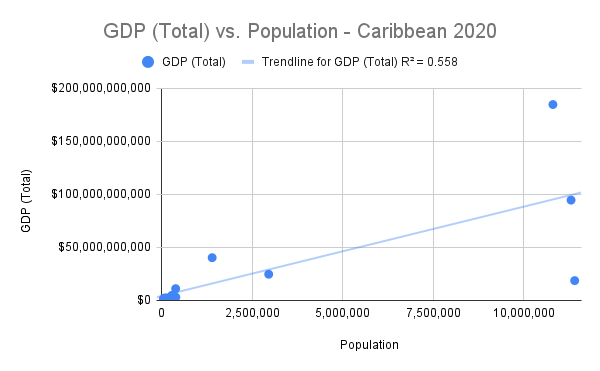
let's say 2020, is there a correlation
between total population and total GDP?
0:33
Is GDP greater when
populations are greater?
0:40
Let's start by filtering our worksheet
to show only data from 2020.
0:45
In cell B1 for year click on the filter
icon to open the filter menu.
0:49
In the section Filter by values,
click Clear.
0:57
This will uncheck everything
in the values window below.
1:02
In the values window,
scroll down and select 2020.
1:07
Then click OK.
1:13
Now our spreadsheet only shows data for
the year 2020.
1:17
Awesome.
1:21
For our scatter plot, we need two columns.
1:22
First, click the header for
column C to select all the values for
1:26
all the countries' populations.
1:29
Then while holding the Command
key on Mac or the Ctrl key on PC,
1:33
click the header for column E to select
the total GDP for all countries.
1:38
Now we are ready to insert a chart
1:45
My suggested chart was a scatterplot,
lucky for me.
1:52
If yours is a different chart type,
go to the chart editor and
1:57
select scatter plot from
the chart type drop down menu
2:00
Let's customize the chart so
we can gain more insights.
2:07
First, let's edit the title to be
more descriptive and centered.
2:11
Double-click on the chart title to open
the chart editor and edit the text.
2:17
I'll say that this is GDP total versus
population in the Caribbean for
2:22
the year 2020.
2:26
And once again, I'll center the text
by clicking on the drop down below.
2:30
Editing the title of the chart is
usually one of the first steps I do when
2:35
customizing, because it sets a clear
expectation of what the data represents.
2:39
If I'm working with multiple charts,
2:44
it becomes more important to keep
everything distinct from each other.
2:46
So as for our data,
2:51
notice how there are many data points
at the bottom left of the chart.
2:52
Those points represent
the smallest countries, and
2:56
they all have small economies.
2:59
As we look over to the right of the chart,
there's the kind of spread for
3:02
the countries with larger populations,
3:06
and it's a little unclear what
exactly the correlation is.
3:09
We can use a trend line to find out
if there is a correlation at all.
3:13
In the chart editor's customize tab,
click on the Series section.
3:18
This is where you can customize the look
of the points on the scatter plot,
3:24
but what I'm looking for
here is a series of checkboxes.
3:29
I'll scroll down and
I'll click on the checkbox for
3:32
trendline, and it draws
a line through the data points.
3:36
The line represents the relationship
between all the points of data.
3:43
Notice how it goes between some
data points, but not all of them.
3:48
That's okay.
3:52
The trendline is not supposed
to be a perfect fit, it's just
3:54
the best fit possible that represents
the correlation between the data.
3:58
There is another way we can make
this correlation more clear.
4:02
I'll scroll down in the chart editor and
click this checkbox to show R squared.
4:06
What is R squared?
4:15
R squared is a statistical measurement
that describes the meaning of
4:17
the trendline.
4:21
It measures the correlation
between two variables.
4:22
In our dataset, those variables
are population size and total GDP.
4:26
I'll leave some resources about R
squared in my Teacher's Notes below.
4:32
For now, there are three things that you
need to know about R squared that will
4:37
help you right away.
4:41
First, an R squared value that is closer
to positive 1 means that there is a strong
4:44
positive correlation
between the two variables.
4:49
Both variables increase or
decrease at the same time with each other.
4:53
Second, a value closer to negative 1
means that there is a strong negative
4:58
correlation.
5:02
When one variable increases,
the other variable decreases.
5:04
Third, a value close to 0 means that
there is a very weak correlation
5:08
between the two variables, and
maybe no relationship exists.
5:13
So, our value is positive 0.558,
5:18
which can be interpreted as
a somewhat moderate correlation.
5:21
The trendline's direction shows a positive
correlation between countries' populations
5:27
and their total GDP.
5:32
In general, as population increases,
so does GDP.
5:34
Let's make sure to include that
information in our Alt text.
5:39
Open the Alt text menu and
copy the title over.
5:44
For our descriptive analysis,
there is a moderate positive correlation
5:57
between population and total GDP for
Caribbean countries in 2020.
6:02
Generally, as population increases,
so does the countries' GDP.
6:08
Remember, you can copy and
paste my titles and
6:14
descriptions for these alt texts
in the Teacher's Notes below.
6:16
Now, let's move this
chart to its own sheet,
6:20
and rename the sheet.
6:30
I'll call this one
Caribbean 2020 Scatter Plot.
6:35
Now it's your turn again.
6:42
Create another scatter plot for another
year to find the correlation between
6:44
population and total GDP for the Caribbean
countries, then add a trendline.
6:49
Remember to add your alt text before
moving your chart to a new sheet.
6:55
You can also find my example
in the Teacher's Notes below.
7:00
When you're ready,
I'll catch you in the next video.
7:05